Nearly one third of the world’s data volume is being generated by the healthcare industry – including critical data points generated by processes and people in healthcare asset and facility management. However, across disciplines within the industry, healthcare has been challenged with being able to capture the power of this data and using it to its full potential.
Within healthcare facility management, the adoption of CMMS has helped to revolutionize the act of capturing, recording, and maintaining data records. But even so, there are some gaps in how data can be used.
When you have a single source of knowledge, teams unlock the true value of their CMMS - this centralized location aggregates data and tells a story of performance, work order/maintenance trends, and so much more - ensuring operational efficiencies and cost-savings.
Turning Data Into Actionable Insights
Whether recording on paper or using a CMMS, there are many data points available for facility and asset management in healthcare, such as:
- Date of Maintenance
- Asset Number
- Asset Description
- Trade
The list goes on... but, what are you doing with those data points? Are they captured, and waiting until a reactive issue occurs for the team to dive deeper into what's been done (and why)?
These standalone data points can be helpful to some degree. They provide an indication of what’s been done; and often, can check the box to verify that “maintenance is complete!” However, turning them into actionable insights can make them more effective.
Pulling together historical work orders, for instance, and grouping them by equipment type and manufacturer can provide insight into whether a specific model may be more apt to need reactive maintenance.
Digging into this data can indicate whether more frequent preventative maintenance could be beneficial to help mitigate future issues. Perhaps the manufacturer recommends that preventative maintenance should occur every six months; but based on records, it shows that four months would be more appropriate to eliminate the reactive issues that commonly occur around month five. In addition, this data can also give insight into whether earlier replacement could be beneficial, improving budget and resource allocation.
Using Visuals for Informed Decisions
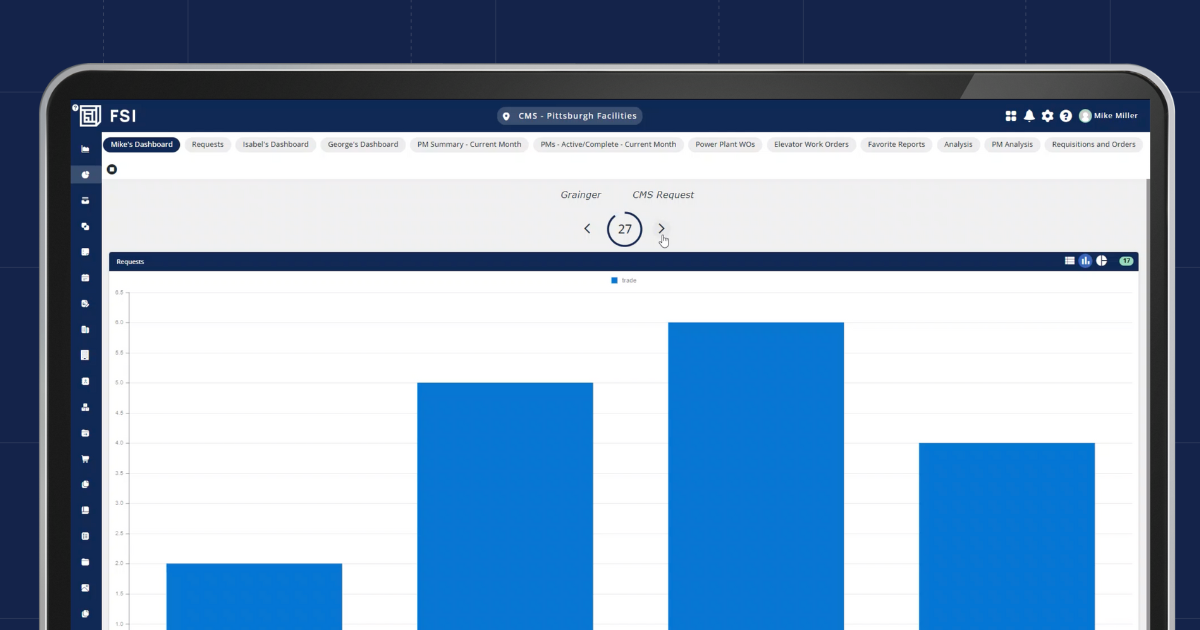
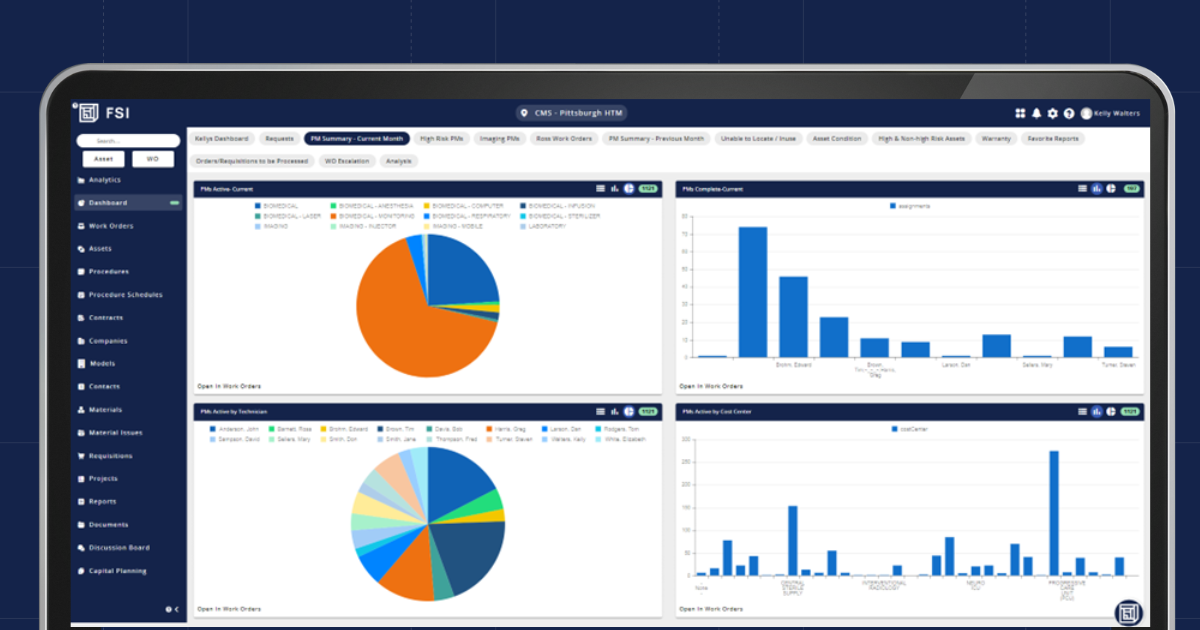
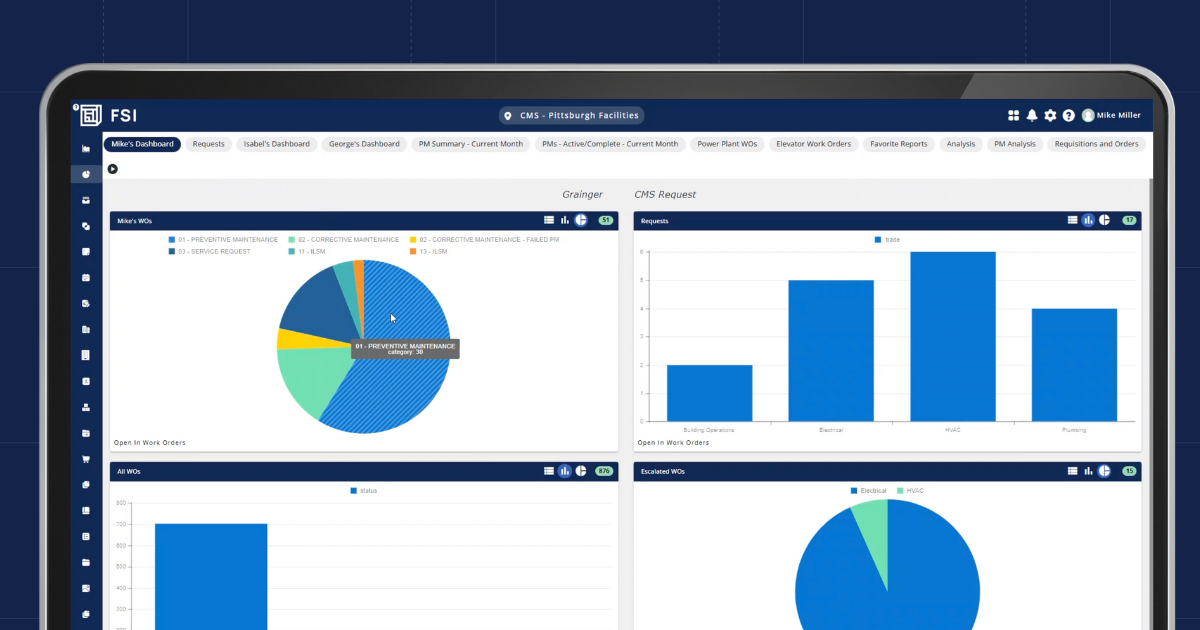
Crunching and reviewing the numbers can provide some valuable insight, but adding visuals to your data analysis can offer a new layer of detail that can uncover additional actions or areas of focus for the facility management team.

Visuals can display data in a few different ways, with bar charts, pie charts, and line graphs being the most common. These types of charts can offer valuable insight into how things are being tracked over time, including trends in:
- Maintenance requests
- Repair costs
- Resource allocation (people and budget)
These visuals can pull in several different data types to provide a cross-section of information that gives deeper insight than looking at the raw data. For instance, a visual chart can use two data sources: the number of maintenance requests for a particular trade and cross-tabulate it with the budget required to maintain this area of the facility. This can be helpful when it comes to budgeting conversations to understand what needs to be allocated where.
In addition to providing insight into overall trends, using visuals to build a Shop Dash can be useful in helping teams see where time is being spent while helping give visibility into how resources are being used.

As a centralized platform that can be displayed on a screen in the facilities office, it can provide insight into ongoing activities to drive seamless collaboration as issues arise. As a bonus, this can help build team morale!
Allocating Resources More Effectively
From limited budgets to filling open vacancies, healthcare facility management teams face ongoing challenges for allocating and managing key resources. While data can’t necessarily solve these challenges, it can help mitigate the impact that they leave by giving essential insight into how to use available resources more effectively.
Resource management benefits from generating actionable insights, meaning that team members can focus attention on where it will matter most.

By having this live in the CMMS, it means that these actionable data points can easily be translated into work orders – making it easier to proactively address potential concerns before they escalate and become reactive problems.
Greater visibility into overall maintenance activities and asset performance can help with budget allocation; making spend more predictable over time to understand where dollars need to go, and when. As healthcare facility management teams continue to face budget constraints, this provides a useful resource – and record – of how money is spent.
Diving Into Your Healthcare Facility Management Data
Often, the biggest challenge isn’t getting the data – but it's getting the data in a place where it can be actionable and accessible. Using a healthcare CMMS like FSI’s CMS brings all data together in one platform, helping to create a cohesive record of what’s happening for both reactive and preventative maintenance actions.
While the CMMS serves as a work order management tool, it captures essential data points to understand everything from maintenance requests to resource allocation to upcoming priorities.
The result? A software platform rich with data – that can be turned into actionable insights to fuel the success of any healthcare facility management team.
If you’re interested in learning more, including how you can access and view your data in FSI CMS, get in touch.